Precondition
- Make sure your Jasper Studio is this specific Version 6.5.1.
- Download the source files here.
- Set up your Jasper Studio environment.
Index
- Changing the SQL
- Adding a Parameter
- Adding a variable
- Content of the Report (bands)
- Properties
- Subreports
- Language
- Source
- Set up Database Adapter
- Preview
Steps
- Above the report, there is a small icon called “DataSet and Query editor dialog”.
- Click it.
- Notice the “Language” is SQL. If it is not, set it.
- Select the database you want to use from the drop-down on the top left (if not already set).
- You should find the SQL in the middle where you can change it. Usually, we create functions and just call them from here with the report’s parameters.
- Press the “Read Fields” button and wait for the fields to populate the lower part of this window.
A fields is indicated as $F{field_name}.
Note: You can also add the fields manually.
- Press “OK” to save and close.
Return to index ⮥
- Add the name and the class which you know your SQL is expecting, e.g., for “Date” it will be
java.util.Date.
- Is For Prompting: If you set this on “Y”, you will see the parameter when you run the Jasper in JasperSoft.
- Special parameters:
- Name:
ad_language
- Class:
java.lang.String
- Default Value Expression:
$P{REPORT_LOCALE}.toString()
Note: This one will take the language from code, depending on the document’s business partner’s language or the login language in some cases.
- Parameters are indicated as
$P{param_name}.
Return to index ⮥
- We usually use variables to calculate data directly in the report, e.g., a sum.
- Add a name and a value class name (e.g.,
java.math.BigDecimal if you want a sum).
- Calculation: Can be none, sum, average, etc.
- Expression: If you selected a calculation method then add the field/parameter/variable that you want to be calculated (e.g., summed up). If no calculation is set then you can add any expression you need.
- Reset type: If you want your variable to be calculated at the end of the report, select Report. Usually it is either Report or Group.
For instance, select Group if you want to obtain the sum per business partner, in cases where there are more than one and you grouped your data by business partner.
- Variables are indicated as
$V{var_name}.
Return to index ⮥
- Title: This band appears only on the first page of the report.
- Page header: If you want your title to appear on each page, you can use this instead of the title band.
- Column header.
- Group header: This band does not appear by default. You have to add it by right-clicking on “Report” above the bands and selecting “Create Group”. Groups are used to group your data according to the field you choose. You can add as many as you need. Just mind the order! You might want to move them further up or down.
- Details: You can have one or more details band. Here you add the detailed data gathered from your SQL.
- Group footer: Usually used to sum up amounts.
- Column footer.
- Page footer: Usually used to show the page number and date.
- Summary: Mostly used when you want to add an additional page to your report to put some separate data, like a summary.
- Background: Mostly used for document watermarks. For example, if a document is not completed and you want to make this apparent to the person reading it.
Return to index ⮥
- Usually we use text fields to add data in the report (see Palette > Basic elements on the upper right).
- Select a field from report and take a look at the “Properties” tab on the lower right.
- There are 6 tabs: Appearance, Borders, Text Field, Inheritance, Hyperlink and Advanced.
- “Advanced” contains all data from the others so you can make changes directly there.
- You can change the font type, font size, styles, etc.
- The field will show an “Expression”. It can be a field name (e.g.,
$F{field_name}), variable (e.g., $V{var_name}), parameter (e.g., $P{param_name}), or resource (e.g., $R{res_name}). But it can also contain an expression like $P{x}!=null ? $F{x} : $F{y}. This means if the parameter x is set then the field x shall be shown. Otherwise, field y shall be shown.
- Print when expression: Probably the most used. It usually starts with “new Boolean(…)” and is used in case you want to hide a field. If you want to hide an entire line where all the fields are null, then you also have to select “Remove Line When Blank” and “Blank When NULL”.
- Pattern: If you have a sum, you probably want your number to appear in a particular way (e.g., for numbers like 1’000.00 you can use
#,##0.00).
- Evaluation time: The default is Now, but there might be cases when you want to evaluate the data per group.
- Things like size and location, you can change them directly from Design.
- You can also set properties for the report and for bands. For example, you can use Print when expression for a band if you only want it to appear in certain cases.
Return to index ⮥
- You can add multiple subreports to the main report.
- They can also have properties like print when expression.
- In the subreport’s “Expression” you have to insert the link to your Jasper subreport between “path/mysubreport.jasper”.
- On “Edit Parameters” you have to add the parameters/fields/variables/resources you already have in your main report and that you want to include in the subreport, passing the value to it.
- Subreports are very useful for reusing existing reports and parts of data that have to be the same in multiple documents.
Return to index ⮥
- You can have your report in multiple languages. You translate them in
.properties files.
- The properties files have names like
report.properties (general translations), report_de.properties (German translations) or report_de_CH.properties (Swiss German translations).
- The fields you want to be translated are of the type resources and their expression looks like this:
$R{res} with res being inside the .properties file (e.g., res=Translated Res).
- The properties files must be saved with the ANSI encoding.
- To add the properties file to your report, you have to go to your report’s properties and on “Resource Bundle” to set the path to your properties file like this:
path/report.
Return to index ⮥
- If you want to view the XML code to your Jasper report, just go to “Source” tab right below your report.
- We usually use this source view when we want to have bold fields in PDF files as well.
- To enable this, you have to write
pdfFontName="Helvetica-Bold" after isBold="true".
Return to index ⮥
- In the Repository Explorer tab, right-click on Data Adapter and then Create Data Adapter.
- In the window Create Data Adapter, choose Database JDBC Connection and click Next.
-
Set your connection preferences. As an example, for localhost:
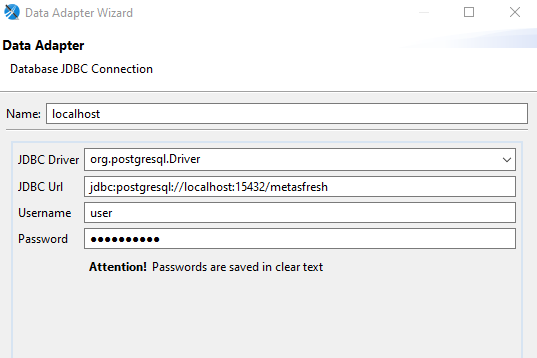
- Afterwards, you can use it in the following steps: X. Preview.
Return to index ⮥
- “Preview” is the last tab under your report.
- It is used to preview the document you just created.
- There you can see all your parameters (if you added any) and fill them in.
- Before you click on “run”, you have to add your database, language Java.
- If you want to set the language for your report you have to click icon “Report Parameter” and add the language via “Report locale” drop-down.
- If you want to go back to the parameters after running the report you have to press the arrow icon “show parameters”.
Return to index ⮥
View source file on GitHub.com